
Turn inspiration into your own evidence
Do not copy the career. Learn how the career is communicated.
Read the evidence
Notice where the example uses scale, change, ownership, and context.
Replace every fact
Write from your real work, even when your numbers or setting are different.
Check the result
Make sure the document remains readable, truthful, and aligned to the role.
Key Skills
Use only the skills you can support with real experience. The example shows the vocabulary; your evidence makes it credible.
Full Statistician Resume Example
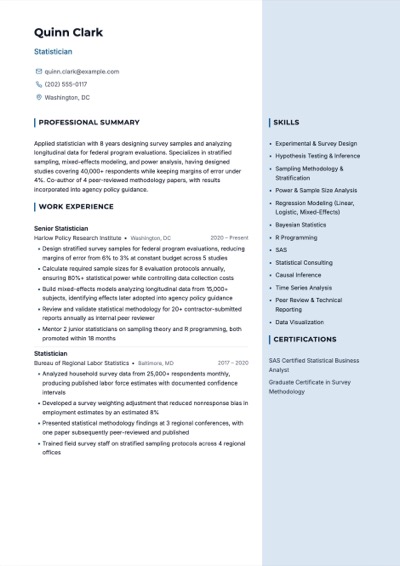
This is a complete fictional sample. Study the structure and evidence patterns, then replace every name, employer, number, skill, and accomplishment with information that is true for you.
Professional Summary
Applied statistician with 8 years designing survey samples and analyzing longitudinal data for federal program evaluations. Specializes in stratified sampling, mixed-effects modeling, and power analysis, having designed studies covering 40,000+ respondents while keeping margins of error under 4%. Co-author of 4 peer-reviewed methodology papers, with results incorporated into agency policy guidance.
Work Experience
Senior Statistician
2020 – PresentHarlow Policy Research Institute — Washington, DC
- Design stratified survey samples for federal program evaluations, reducing margins of error from 6% to 3% at constant budget across 5 studies
- Calculate required sample sizes for 8 evaluation protocols annually, ensuring 80%+ statistical power while controlling data collection costs
- Build mixed-effects models analyzing longitudinal data from 15,000+ subjects, identifying effects later adopted into agency policy guidance
- Review and validate statistical methodology for 20+ contractor-submitted reports annually as internal peer reviewer
- Mentor 2 junior statisticians on sampling theory and R programming, both promoted within 18 months
Statistician
2017 – 2020Bureau of Regional Labor Statistics — Baltimore, MD
- Analyzed household survey data from 25,000+ respondents monthly, producing published labor force estimates with documented confidence intervals
- Developed a survey weighting adjustment that reduced nonresponse bias in employment estimates by an estimated 8%
- Presented statistical methodology findings at 3 regional conferences, with one paper subsequently peer-reviewed and published
- Trained field survey staff on stratified sampling protocols across 4 regional offices
Research Statistician
2015 – 2017Camden University Center for Survey Research — Camden, NJ
- Supported design and analysis for 6 externally funded research studies, including sample size calculations and hypothesis testing
- Built data cleaning and analysis pipelines in R for datasets exceeding 10,000 observations
- Co-authored 2 peer-reviewed papers on survey weighting techniques submitted to applied statistics journals
Education
- M.S., Statistics — University of Maryland, College Park · 2015
- B.S., Mathematics — Rutgers University · 2013
Certifications
- SAS Certified Statistical Business Analyst
- Graduate Certificate in Survey Methodology
Achievement bullet patterns
Adapt the sentence pattern to your work. Never copy an employer, number, tool, or outcome that is not true for you.
- 1
Designed a stratified survey sample of 4,200 respondents for a federal program evaluation, reducing the margin of error from 6% to 3% at the same budget
Adapt the pattern; do not copy facts that are not yours.
- 2
Calculated required sample sizes for 8 clinical study protocols, ensuring 80%+ statistical power while avoiding over-enrollment costs exceeding $200K
Adapt the pattern; do not copy facts that are not yours.
- 3
Built mixed-effects models analyzing longitudinal data from 15,000 subjects, identifying a treatment effect later adopted into agency policy guidance
Adapt the pattern; do not copy facts that are not yours.
- 4
Co-authored 4 peer-reviewed methodology papers on survey weighting techniques, cited in 2 subsequent federal statistical standards documents
Adapt the pattern; do not copy facts that are not yours.
Practical writing guidance
- 1
State your study design specialty in your summary, such as survey sampling, clinical biostatistics, or econometric modeling, rather than a generic "data analysis" title
- 2
Quantify sample sizes, margins of error, and statistical power: "Designed a stratified sample of 4,200 respondents achieving a 3% margin of error" proves rigor
- 3
Report hypothesis test and confidence interval results in plain terms, not just the test names, so non-statistician reviewers understand the finding
- 4
List peer-reviewed publications, technical reports, or IRB-approved protocols separately from your work experience if you have them
- 5
Distinguish inferential software (R, SAS, Stata) from descriptive or reporting tools, since methodology-focused roles weight them differently
- 6
Translate research findings into decisions influenced: policy changes, funding allocations, or methodologies adopted department-wide
How to write a statistician resume
Lead with your study design and inferential approach, not your toolkit
Report inferential results and design choices, not just analyses completed
Separate methodology credentials from software skills for ATS and reviewers
Frequently Asked Questions
How is a statistician resume different from a data scientist resume?
Foreground study design, sampling methodology, and inferential rigor rather than model deployment. Emphasize hypothesis tests, confidence intervals, and power calculations rather than production ML systems, since hiring committees are screening for methodological soundness, not software engineering.
Should I list my publications on a statistician resume?
Yes, if you have peer-reviewed publications, technical reports, or conference presentations, list them in a dedicated section with citation-style formatting. For academic, government, or pharma roles, publications signal your methodology survived external scrutiny, which outweighs a tools list.
What statistical software should I list, and how much detail is needed?
List the software you used for inferential work, such as R, SAS, Stata, or Python's statsmodels, and note the depth: package authorship, custom simulation code, or production-scale analysis. Avoid listing tools used only for descriptive summaries alongside your core inferential toolkit.
How do I show impact when my work is research rather than a product launch?
Translate research impact into decision terms: a sample size that made a trial adequately powered, a methodology adopted department-wide, or findings that changed policy. Quantify wherever possible, such as "designed a stratified sample of 4,200 respondents at a 3% margin of error."